

Table of Contents
Ever found yourself in the heart of a bustling city at rush hour? That’s kind of what process management in Linux is like. It’s about overseeing and directing the flow of tasks, ensuring everything runs smoothly, and nothing crashes or stalls.
Fundamentals of Linux Processes
What are Linux Processes?
Linux, like all Unix-like systems, works with a concept known as ‘processes’. Think of processes as individual tasks, like cars on a busy highway, each trying to get to their destination.
Why Managing Processes is Important?
Without proper management, these tasks can consume excessive resources, creating a gridlock in your system. That’s where process management comes in—it’s like having a traffic management system to ensure smooth flow.
Different Ways to Manage Linux Processes
Using Top Command
Just like traffic cameras giving real-time traffic data, the ‘top‘ command in Linux provides a dynamic, real-time view of the processes running on a system.
Using Htop Command

Then we have ‘htop‘, an even more colorful and interactive traffic monitor. It offers a full view of processes running, plus it gives you the power to control them.
Using PS Command
Imagine a traffic snapshot at a particular moment—that’s what ‘ps’ command does. It provides a static snapshot of current processes.
Detailed Guide on Viewing Processes in Linux
Using ‘ps’ Command
The ‘ps’ command is like a snapshot of the processes running on your system at a given moment. It’s like taking a picture of a busy intersection to assess the traffic situation.
Examples:
- Basic ‘ps’ command: Running the ps command without any options or arguments will display a list of processes owned by the current user. The output typically includes columns like PID, CPU usage, memory usage, and the command associated with each process.
- Customizing the output: The ps command provides various options and arguments to customize the output. For example, you can use the -e option to display information about all processes on the system, not just those owned by the current user. You can also use the -o option to specify the columns you want to include in the output.
- Filtering processes: The ps command allows you to filter the processes based on certain criteria. For instance, you can use the -u option followed by a username to display processes owned by a specific user. The -C option can be used to filter processes by command name.
- Monitoring processes: By combining the ps command with other utilities, you can create powerful process monitoring tools. For instance, you can use the watch command to run ps repeatedly at a specific interval, providing an updated view of the processes.
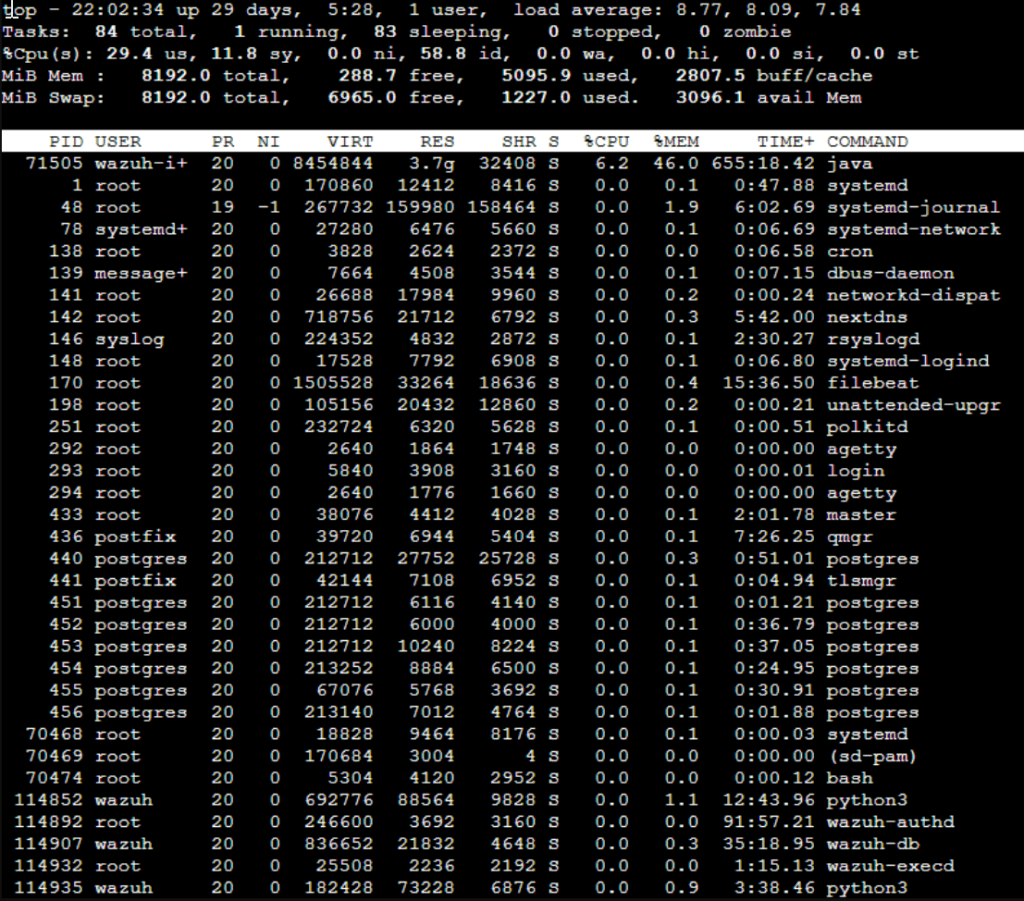
Using ‘top’ Command
If ‘ps’ is a snapshot, the ‘top’ command is a live CCTV feed. It provides real-time updates of system usage and list of running processes. It’s like a traffic chopper reporting live on the morning commute.
This analogy highlights the difference between the ‘ps’ command and the ‘top’ command. While ‘ps’ gives you a momentary snapshot of processes at a specific time, the top command provides real-time updates of system usage and actively running processes. It’s like a live CCTV feed that continuously monitors the system and presents up-to-date information.
Examples
- Basic top command: Running the top command without any additional parameters will display a continuously updated list of processes, along with system usage information such as CPU usage, memory usage, and load averages.
- Sorting processes: The top command provides various options to sort and prioritize processes based on specific criteria. For example, you can sort processes by CPU usage, memory consumption, or any other relevant metric to identify resource-intensive processes.
- Changing update frequency: By default, the top command updates the displayed information every few seconds. However, you can customize the update interval to suit your needs. For example, you can specify a different update interval using the -d option followed by the desired delay in seconds.
- Filtering processes: The top command allows you to filter the displayed processes based on certain criteria. You can use the top command with options such as -u to only show processes owned by a specific user or -p to monitor specific process IDs.
Using ‘htop’ Command
Lastly, there’s ‘htop’. If ‘top’ is a CCTV feed, ‘htop’ is an advanced drone overview of the entire traffic situation. It not only provides an enhanced view but also allows direct control over processes.
This analogy highlights the enhanced capabilities of the htop command compared to the top command. While top provides a real-time view of system usage and processes, htop takes it a step further by offering additional features and functionality. It’s like having an advanced drone providing an aerial view of the traffic situation, enabling a comprehensive understanding of the system’s state.
- Enhanced visualization: When you run the htop command, you’ll see an interactive and organized display of processes. It presents them in a hierarchical manner, making it easier to identify parent-child relationships and dependencies between processes.
- Detailed system information: htop not only provides a live overview of processes but also offers detailed system information. You can view CPU and memory usage per core, network activity, and disk usage, among other system metrics, in real-time.
- Direct process control: One of the notable features of htop is its ability to directly interact with processes. You can send signals to processes, such as terminating or pausing them, directly from the htop interface, making it convenient for managing system resources.
- Customization and sorting: Similar to the top command, htop allows you to customize the displayed information and sort processes based on specific criteria. You can filter processes, highlight specific process types, and adjust the display to focus on relevant information.
Benefits of ‘htop’ over ‘top’
‘htop’ has several advantages, such as an easier-to-understand layout and the ability to scroll vertically and horizontally. So, it’s like comparing a regular traffic cam to an ultra-HD drone feed.
- Enhanced layout: The layout of htop is designed to be more user-friendly and easier to understand compared to top. It provides a clear and organized display of system information, making it easier to identify processes and their resource usage.
- Vertical and horizontal scrolling: Unlike top, htop allows both vertical and horizontal scrolling. This feature is especially useful when working with systems that have a large number of processes or when viewing wide command lines or process details that exceed the width of the terminal.
- Colorful and informative interface: htop utilizes colors and visual indicators to represent different types of processes and system resources. This enhances readability and allows users to quickly identify resource-intensive processes or anomalies in system usage.
- Interactive process management: htop enables users to interactively manage processes directly from the interface. It provides intuitive keybindings to perform actions like sending signals to processes (e.g., terminating, pausing) and changing process priority.
- Customization options: htop offers customization options to tailor the display according to individual preferences. Users can adjust the colors, sort processes based on various criteria (e.g., CPU usage, memory usage), and apply filters to focus on specific processes or process groups.
- Detailed system information: In addition to process information, htop provides detailed system information such as CPU utilization per core, memory usage, load averages, and network activity. This comprehensive overview allows users to monitor system resources more effectively.
Absolutely, I’ll update the commands into the code blocks:
Guide on How to Kill a Process by PID in Linux
In our bustling city of Linux processes, sometimes a vehicle (a process) breaks down in the middle of traffic, causing a jam. When you can’t get it moving again, the only option is to remove it entirely. This is akin to killing a process in Linux, and it often involves the Process ID (PID) – the license plate number for our ‘car’. Let’s break this down further:
Finding the PID
In Linux, you can find the PID by using commands such as ps, top, or htop. Here’s an example using ps:
ps -auxThis command displays a detailed list of all current processes. It’s equivalent to a registry of all vehicles currently on the road. The output includes columns for USER, PID, %CPU, %MEM, VSZ, RSS, TTY, STAT, START, TIME, and COMMAND. Here, PID is what we’re interested in.
For instance, you may find a line like this in the output:
root 1478 0.0 0.3 116952 7448 ? Ss Jun28 0:06 /usr/sbin/cron -fHere, ‘1478’ is the PID, which is unique to this process.
Using ‘kill’ Command
Once you’ve identified the PID, the kill command is your tow truck. You can use it to terminate the process. Here’s an example:
kill 1478This command sends a ‘SIGTERM’ signal to the process with PID 1478, asking it to terminate itself gracefully. It’s like a tow truck trying to nudge a broken-down car to the side of the road.
Common ‘kill’ Options
Different situations may call for different strategies. Here are a few options you can use with the kill command:
- Soft Kill (SIGTERM): This is the default signal sent by
kill. The commandkill 1478orkill -SIGTERM 1478both achieve this. It’s like asking the driver (the process) to move their car (terminate) politely. If the process is well-behaved, it will comply.
kill 1478
kill -SIGTERM 1478- Hard Kill (SIGKILL): This signal is used when a process won’t terminate with SIGTERM. The command is
kill -SIGKILL 1478orkill -9 1478. This is the equivalent of forcibly towing away the broken-down vehicle. Be careful with this option, as it doesn’t allow the process to clean up its resources.
kill -SIGKILL 1478
kill -9 1478
Using ‘killall’ Command
The killall command is another powerful tool in your arsenal. It allows you to terminate all processes with a specific name, which is akin to removing all cars of a certain make or model from the road. Here’s an example:
killall cronThis command sends a termination signal to all instances of ‘cron’ running on your system.
When to Use ‘killall’
killall is particularly useful when you want to terminate multiple instances of a process at once. However, be aware that it is a potent command and, if used carelessly, can cause system instability. It’s like removing all cars of a specific model from the road – it might clear the
traffic, but it could also cause problems if those cars were actually important for the city’s functioning.
Conclusion
Process management is an integral part of Linux system administration. It involves viewing, managing, troubleshooting, and sometimes killing processes. It’s like managing traffic in a bustling city. Understanding how to use tools like ‘ps‘, ‘top‘, ‘htop‘, ‘kill‘, and ‘killall‘ will help keep your system running smoothly and avoid gridlocks. So keep honing your skills and happy driving on the highway of Linux processes!